Why finance managers need a FinOps playbook
Cloud has moved a big chunk of technology spending from capital expenditure to highly variable operating expense. That variability is powerful — but it also makes budgets harder to control when finance and engineering are not looking at the same numbers in the same way.
FinOps exists to solve exactly this problem. It is a cultural and operational framework that brings finance, engineering, and business teams together to maximise the value of cloud spend. For finance managers, FinOps is the missing playbook that turns opaque invoices into actionable cost controls — without slowing down engineering delivery. This article walks through a practical, finance-first FinOps playbook you can implement over the next 90 days.
Understand what FinOps really is (and isn't)
FinOps is not just a new word for "cloud cost cutting." According to the FinOps Foundation, it is an operational framework and cultural practice that maximises business value from technology while creating financial accountability through collaboration between finance, engineering, and business teams.
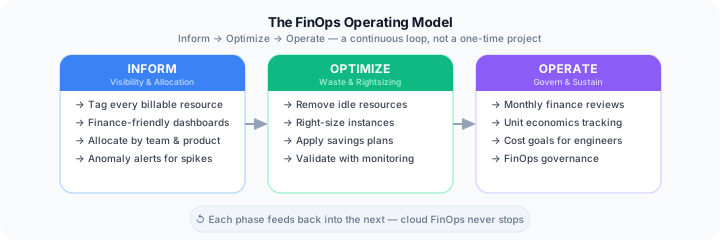
The FinOps loop is a continuous cycle — optimizations from one phase feed directly into improved visibility in the next.
Make cloud spend visible and correctly allocated. As finance manager, this is your primary ownership layer.
Use visibility to remove waste and right-size resources. Co-drive this with engineering, not instead of them.
Embed cost awareness into everyday engineering and finance workflows so gains compound over time.
Fix tagging and cost allocation first
Every effective FinOps programme starts with consistent tagging and allocation. Without them you cannot attribute spend or hold the right teams accountable. Think of tagging as turning on the lights in a dark room: suddenly you can see where all the hidden costs are lurking.
Design a tagging scheme finance can read
Work with your cloud or platform team to define a minimal but strict tagging policy. These tags should be required for all billable resources, enforced via IaC templates and policy tools.
cost_center / team Maps to your internal cost center structure product / application Which product or service this resource supports environment prod, stage, dev, sandbox owner Responsible team or squad Map cloud spend into your financial structure
Once tags are in place and enforced, you can do the financial mapping that makes cloud spend meaningful to your P&L and board reporting.
Build a finance-friendly cloud spend dashboard
Replace static invoices and CSV exports with a live dashboard that reflects how your organisation thinks about money. The key is that finance can access and understand the numbers without logging into raw cloud provider consoles.
| Dashboard tile | What it shows and why it matters |
|---|---|
| Total cloud spend trend | Month and quarter vs budget and last period — your top-line control view |
| Spend by team / cost center | Uses the cost_center tag to map to your internal cost center structure |
| Spend by product & environment | How much is going to production vs staging vs dev — catches non-prod bloat |
| Top 10 cost drivers | Services, regions, or applications accounting for the majority of your bill |
| Anomalies & spikes | Visual markers where costs deviate significantly from normal baselines |
Native tools (AWS Cost Explorer, Azure Cost Management) plus third-party FinOps platforms can generate these views. The decision of which platform matters less than ensuring finance has a dashboard they can actually interpret and act on.
Introduce unit economics — cost per user, transaction, and feature
Raw cloud spend only tells you "how much," not "whether it's worth it." Unit economics turns cloud costs into business-relevant ratios that connect your infrastructure to revenue, margin, and product decisions.
Cost per active user
Total cloud spend for product ÷ monthly active users
Cost per API call
Relevant infrastructure spend ÷ number of successful calls
| Business model | Primary unit metric | What it reveals |
|---|---|---|
| B2B SaaS | Cost per customer or per account | Ties infrastructure directly to contract value and gross margin |
| B2C / Freemium | Cost per active user | Reveals hidden free-tier infrastructure burden |
| Transactional | Cost per transaction, ride, or payment | Exposes whether unit economics improve or worsen at scale |
| AI features | Cost per 1,000 inferences or tokens | Makes AI spend measurable alongside its business contribution |
Monitor these over time. Rising unit costs often signal architectural inefficiencies or features that are too expensive relative to their revenue contribution.
Run regular cloud cost reviews with engineering
Once you have dashboards and unit metrics, create a cadence where finance and engineering review them together. Separate meetings create information silos; joint reviews create shared ownership of outcomes.
Monthly executive / finance review
Focus on trends and trade-offs, not individual instances. Bring in product and leadership to connect spend to roadmap decisions.
Weekly engineering review
Finance does not need to join every technical discussion, but should define expectations and help quantify optimization impact in financial terms.
Build your 90-day FinOps roadmap
A 90-day plan makes FinOps concrete and avoids the trap of indefinite preparation. Each month builds on the last: you cannot optimise what you cannot see, and you cannot govern what you have not optimised.
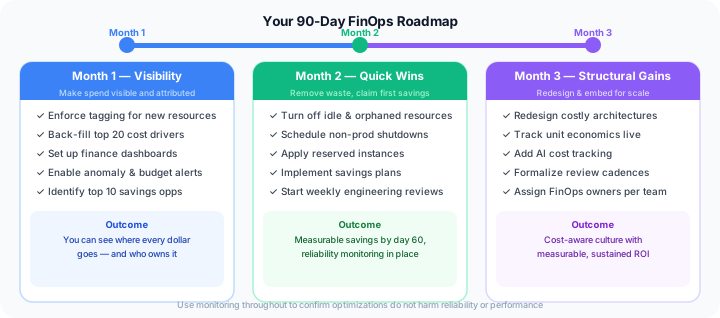
Each month builds on the last. Use monitoring throughout to confirm optimizations do not harm reliability or performance.
Throughout all three months, use monitoring to validate that optimization does not harm reliability or performance. The goal is smarter spend — not outages caused by cutting the wrong thing at the wrong time.
Work with AI and cloud costs together, not separately
As AI usage grows, treat AI costs as part of your FinOps scope rather than a separate black box. Usage-based AI billing — where cost scales with token counts, inferences, and model selection — makes it especially easy for spend to grow invisibly without proper attribution.
Tag AI-related resources and services explicitly — for example, workload=AI or service=openai.
Track cost per 1,000 inferences, per AI feature, and per team alongside quality and latency.
Combine AI cost metrics with business success metrics: conversion lift, handling time reduction, retention gains.
Distinguish investments that drive clear ROI from experiments that are interesting but not yet justified.
The test for any AI investment: can you show the cost per feature or workflow, and map it to a measurable business outcome? If not, you have a monitoring gap, not an AI strategy.
Make monitoring part of the FinOps loop
FinOps is not a quarterly spreadsheet exercise. It is an ongoing loop where monitoring, analysis, and optimization reinforce each other continuously.
Cost, utilisation, performance, and anomalies are tracked in near real time — not discovered on month-end invoices.
Finance and engineering use shared dashboards to spot trends and issues early, before they compound.
Decisions are made with both performance and cost in mind, then validated by the same monitoring layer.
The question that measures FinOps maturity:
"How much cloud and AI spend did we save this quarter, where did we save it, and did it affect our reliability or user experience?"
With a healthy FinOps practice and the right monitoring in place, that answer becomes straightforward — and cloud stops being a mysterious, ever-growing line item and becomes a controlled lever for value creation.
The finance manager takeaway
FinOps for finance managers is not about learning cloud engineering. It is about building the visibility, attribution, and governance layer that lets you see cloud and AI spend in the language of the business — and hold the right people accountable for it.
Start with tagging and dashboards in month one. Claim quick wins in month two. Build structural cost discipline in month three. Then keep the loop running — because FinOps, like the cloud itself, is never a finished project.
Written by
Dileep KK, MonitorGiant
LinkedIn21+ years in IT infrastructure management and observability. Built monitoring dashboards, custom alerting pipelines, and AI token-tracking systems across cloud platforms — AWS, GCP, and Azure — and for organisations spanning defence IT, IoT manufacturing, digital marketing, SaaS email, insurance broking, parliamentary digital services, and educational ERP. Active directory, SIEM, WAF, Cloudflare, MSSQL, Linux, Windows, Entra ID — operated at every layer of the stack.