Head of DevOps / Platform: Building Cloud Cost Guardrails with Monitoring and Automation
Platform leaders see cloud bills rising before anyone else, but rarely get the authority to mandate how teams build. The answer is guardrails — monitoring and automation that makes cost-aware behaviour the default, not a policy reminder nobody reads.
From Firefighting Bills to Preventing Waste by Design
Heads of DevOps and Platform Engineering occupy an awkward position in cloud cost management. They are usually the first people to see a bill spike — because they own the infrastructure tooling, the CI/CD pipelines, and the monitoring dashboards where anomalies surface. But they often lack the cross-team authority to mandate how product engineers build and deploy their services.
The traditional response is policies and documentation: "Use instance type X. Tag everything. Clean up non-prod on Fridays." These work until the team grows past fifteen engineers, at which point nobody can keep up with reading or enforcing them. Bills continue rising. Platform leaders keep firefighting.
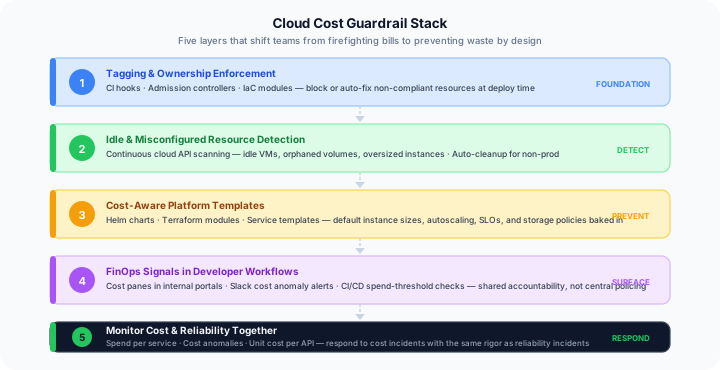
The more durable solution is to build cost guardrails into the platform itself — monitoring and automation that keeps teams inside safe boundaries by default, without requiring constant enforcement from a central team. This guide walks through five layers of that guardrail system.
Enforce Tagging and Ownership
Every other guardrail in this stack depends on accurate resource tagging. Without it, you cannot route cost attribution to the right team, you cannot automate cleanup without risk, and you cannot surface per-service cost signals to developers. Tagging is the foundation.
The platform team should own the tooling that enforces tagging — not a wiki page that asks engineers to tag resources. That means three things working together:
- Admission controllers (OPA/Gatekeeper on Kubernetes, AWS Service Control Policies, GCP Organization Policies) that reject or quarantine untagged resources before they are created.
- CI hooks that validate IaC plans against the tag schema before merge — failing the pipeline rather than the production deployment.
- IaC module auto-injection for predictable tags like environment and team name, so developers do not have to remember to set them manually.
| Tag | Purpose | Enforcement Mechanism |
|---|---|---|
| owner / team | Routes cost attribution to the right team budget | Admission controller rejects untagged resources |
| environment | Separates prod, staging, dev, and sandbox costs | IaC module injects automatically from workspace context |
| product / service | Enables product-level cost allocation | CI hook blocks merge if service tag is missing |
| data-classification | Required for compliance and retention policy automation | Policy engine enforces correct storage class per tier |
Detect Idle and Misconfigured Resources Automatically
Idle and orphaned resources are the most recoverable form of cloud waste — they are spending money without delivering any value, and they accumulate invisibly across environments that nobody is watching closely. A continuous detection system is far more effective than periodic manual audits.
Use cloud provider APIs (CloudWatch, GCP Cloud Monitoring, Azure Monitor) combined with your observability platform to run regular sweeps against the targets below. The key is to have a graduated response — notify before you delete, always preserve production, and automate aggressively in non-production environments where the risk is low.
| Resource Type | Idle Signal | Recommended Action |
|---|---|---|
| VMs and containers | CPU < 5% for 7+ days | Notify owner; auto-stop in non-prod after 48h |
| Databases (RDS, CloudSQL) | Zero connections for 5+ days | Notify owner; snapshot and pause in non-prod |
| Orphaned volumes | Unattached for 3+ days | Tag for review; auto-delete in non-prod after 14d |
| Unused elastic IPs / static IPs | Unassociated for 24+ hours | Auto-release — charged even when unused |
| Load balancers with no targets | Zero healthy targets for 48h+ | Notify team; auto-remove from non-prod stack |
| Oversized instances | CPU/memory < 20% over 30-day window | Rightsizing recommendation surfaced in portal |
Production safety rule: Never auto-delete or auto-stop production resources. Notifications only in prod. Automated action is appropriate in dev, staging, and sandbox environments with owner notification windows.
Bake Cost Controls into Platform Templates
The most scalable way to enforce cost-aware behaviour is to make it the path of least resistance. When a developer picks up a Helm chart or Terraform module from your internal platform, it should already have reasonable defaults for instance sizing, autoscaling, storage class, log retention, and observability. The developer does not make these choices from scratch — they inherit sensible defaults and override only when they have a specific reason to.
This is the principle of paved roads applied to cost: the platform team builds one well-lit, cost-optimised path. Teams that need to diverge can, but they bear the overhead of doing so explicitly.
| Template Component | Recommended Default | Why It Saves Money |
|---|---|---|
| Instance size | Start at t3.medium / e2-standard-2 with autoscaling enabled | Forces explicit decision to go larger rather than defaulting to over-provision |
| Autoscaling config | Min 1, max 10; scale-down after 5 min below threshold | Prevents idle scale-out from persisting overnight |
| Storage class | Standard for < 30 days, IA / Nearline for 30–90 days, Archive for > 90 days | Automates tiered retention without per-team decisions |
| Log retention | 30 days hot, 90 days cold storage, delete after 365 days | Log storage is a silent cost driver that balloons unmanaged |
| Default SLO + alerts | 99.5% availability alert, p99 latency alert at 2×baseline | Every service gets baseline observability without extra setup |
Integrate FinOps Signals into Developer Experience
Cost accountability only distributes across the engineering organisation if developers can see cost signals in the places they already work — not in a separate FinOps dashboard that requires a different login and a different mental model.
Three integration points have the highest impact per effort:
Cost panes in your internal developer portal
Each service page in Backstage or your equivalent should show current monthly spend, MTD trend, and cost-per-unit if applicable. Engineers should be able to see the cost impact of a deployment within the same view where they check health and uptime. This creates the feedback loop that drives good instincts over time.
Cost anomaly alerts in engineering Slack channels
When spend for a service spikes by more than a defined threshold — say 20% above the 7-day rolling average — an alert should appear in the same Slack channel where performance alerts land. This treats a cost anomaly as an incident, not a finance report item that arrives four weeks later on a bill. Teams learn to respond to cost spikes with the same urgency as p99 latency spikes.
Cost-impact checks in CI/CD
Tools like Infracost can calculate the projected monthly cost delta of an infrastructure change before the pull request is merged. Adding a CI check that warns — not fails — when a change is projected to increase monthly spend by more than a threshold (say $500/month) creates a natural review moment. The developer sees the number, the reviewer sees the number, and the conversation happens before the bill, not after.
Monitor Cost and Reliability Together
The final guardrail closes the loop: your monitoring platform should watch cost-related signals with the same rigour it applies to uptime and latency. A cost spike that doubles a service's monthly bill in 48 hours is a cost incident, and it deserves the same detection, triage, and post-mortem process as a reliability incident.
The signals worth monitoring continuously alongside reliability metrics are:
Attribute costs to your service topology so that a spike in one service does not hide inside a single aggregate number. Environment-level splits separate production cost from dev/staging waste.
Statistical anomaly detection on daily and hourly spend patterns. A 3× spend spike at 2 AM in a non-prod environment is as actionable as a 500ms latency spike — it should wake someone up.
Track cost per API call, per user action, or per AI model invocation over time. A rising unit cost trend even at flat volume means your cost model is deteriorating — catch it before it compounds.
If the current spend trajectory will exhaust the monthly budget before month end, trigger an alert with enough lead time to investigate and course-correct — not a notification on day 30 when the damage is done.
When cost and reliability monitoring live in the same platform, on-call engineers develop a natural instinct to check both dimensions when investigating an incident. A traffic spike that causes latency to rise and cost to spike tells a different story from a latency spike caused by a bad deployment — and the monitoring view makes that visible immediately.
Putting the Guardrail System Together
The five guardrails are designed to be layered progressively. Most platform teams will not implement all five in the first quarter. A practical sequencing is to start with tagging enforcement — it unlocks every subsequent layer — then add idle detection, then platform templates. FinOps signals in DevEx and joint cost-reliability monitoring can be added once the underlying data quality is solid.
The goal is to shift from a cycle of detecting waste reactively on monthly bills to preventing it through the normal path of development. When the platform itself guides teams toward cost-aware defaults, guardrails stop feeling like restrictions and start feeling like good tooling.
A monitoring platform like MonitorGiant contributes to guardrails 2 and 5 directly: continuous monitoring of uptime, API health, and cost-related signals provides the data layer for anomaly detection and the per-service reliability view that sits alongside cost attribution in developer portals and exec dashboards.
Monitoring That Watches Reliability and Cost Together
MonitorGiant gives DevOps and Platform teams continuous visibility into uptime, API health, SLO attainment, and cost signals — the data layer your guardrail system needs. Start in minutes, no card required.
Written by
Dileep KK, MonitorGiant
LinkedIn21+ years in IT infrastructure management and observability. Built monitoring dashboards, custom alerting pipelines, and AI token-tracking systems across cloud platforms — AWS, GCP, and Azure — and for organisations spanning defence IT, IoT manufacturing, digital marketing, SaaS email, insurance broking, parliamentary digital services, and educational ERP. Active directory, SIEM, WAF, Cloudflare, MSSQL, Linux, Windows, Entra ID — operated at every layer of the stack.