CXO Dashboard: One Page That Shows Whether Technology Spend Is Healthy
Fragmented reports make it impossible to answer the board-level question: is our technology spend healthy relative to the value it delivers? A six-metric CXO dashboard solves that — combining reliability, cost, and business outcomes on a single page.
Why C-Suites Need a Unified Tech Spend View
Most C-suite leaders see technology through fragmented reports. Uptime lives in one monitoring tool. Cloud spend sits in a billing dashboard that only FinOps knows how to read. Product metrics come from a third system. And AI model costs are tracked — if at all — in a spreadsheet someone owns on their laptop.
The result is that board-level questions go unanswered. "Are we getting value for what we spend on technology?" becomes a two-week exercise in pulling data together rather than a dashboard refresh. Leaders make infrastructure investment decisions with incomplete information, and waste accumulates invisibly.
A CXO dashboard — a single, consistently maintained page covering six health metrics — makes technology spend legible to the whole C-suite without requiring any of them to become cloud experts. It also creates the accountability structure that good FinOps, reliability engineering, and governance programs need to be taken seriously.
The Six Metrics Every CXO Dashboard Should Include
Drawing from cloud governance, FinOps practice, and unit economics principles, the following six metrics cover the full picture of technology health — from whether the product works, to whether the spend is efficient, to whether the investments are strategically sound.
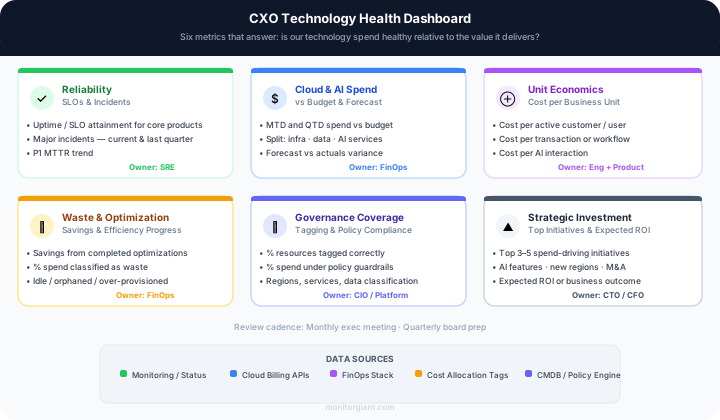
Reliability — SLOs & Incidents
Owner: SRE / Engineering- Uptime and SLO attainment for your core products and APIs
- Major incidents in the current and prior quarter — count and MTTR trend
- Any active or unresolved P1/P2 issues at the time of the review
Why it matters: Reliability is the baseline. Every dollar of cloud spend is wasted if the service it supports is unreliable. Boards and investors increasingly ask about SLA performance directly, especially post-incident.
Cloud & AI Spend vs Budget
Owner: FinOps / CFO- Month-to-date and quarter-to-date spend vs budget and rolling forecast
- Breakdown into infrastructure, data services, and AI/ML workloads
- Variance explanation: what drove overages or underspend this period
Why it matters: Cloud bills grow fast and surprise late. A C-suite view needs a single number with a clear budget signal — green, amber, or red — not a cost explorer screenshot that requires interpretation.
Unit Economics — Cost per Business Unit
Owner: Engineering + Product- Cost per active customer or user (the clearest tie to gross margin)
- Cost per transaction, checkout, or key workflow
- Cost per AI interaction where AI features are a meaningful spend category
Why it matters: Raw spend numbers tell you nothing about efficiency. Unit economics show whether costs are scaling in proportion to business value, or outpacing it. A rising cost-per-user with flat revenue is a margin warning.
Waste & Optimization Progress
Owner: FinOps / Platform Engineering- Estimated savings from optimizations completed this quarter
- Percentage of current spend classified as waste — idle, orphaned, or over-provisioned resources
- Planned optimizations for next 90 days and their projected savings
Why it matters: Waste is a controllable lever. Showing it explicitly creates accountability and surfaces the return on FinOps investment. Leaders who see 12% of spend flagged as waste are more likely to fund the engineering time to fix it.
Governance Coverage
Owner: CIO / Platform Team- Percentage of cloud resources tagged correctly against your taxonomy
- Percentage of spend covered by active governance policies
- Gaps by region, service, team, or data classification tier
Why it matters: Governance coverage is a leading indicator. Low tagging compliance means cost attribution will degrade, forecasts will be wrong, and compliance audits will be painful. Tracking it at the C-suite level signals that data quality is a strategic concern.
Strategic Investment View
Owner: CTO + CFO- The top 3–5 initiatives driving meaningful spend increase — for example, AI feature rollout, new region launch, or data platform migration
- Expected ROI or business outcome tied to each initiative
- Spend-to-date vs original estimate for multi-quarter programs
Why it matters: Without this context, cost increases look like runaway spend. The strategic investment view gives the board a reason for the numbers — and a commitment to track whether the expected return materialises.
Where to Pull Each Metric From
Every metric on the dashboard needs a named source and a named owner. Without that, data will be stale by the time it reaches the C-suite review. The table below maps each metric to its natural data source and the signal it contributes.
| Metric | Primary Source | What You Pull |
|---|---|---|
| Reliability | Uptime monitoring platform (MonitorGiant) | SLO attainment %, incident log, MTTR |
| Cloud & AI Spend | AWS Cost Explorer / GCP Billing / Azure Cost Mgmt | MTD spend, budget alerts, AI cost breakdowns |
| Unit Economics | FinOps stack + product analytics | Cost pools tagged by team/product + MAU or transaction counts |
| Waste | Cost optimisation tools (Infracost, CloudHealth) | Rightsizing recommendations, idle resource flags |
| Governance | CMDB or cloud asset inventory | Tag compliance %, policy scope coverage |
| Strategic Investment | Finance / program management system | Initiative budget vs actuals, owner, expected ROI |
How to Implement the Dashboard
The CXO dashboard does not need to be a sophisticated BI tool on day one. Many teams start with a shared slide deck or a live document that gets updated by metric owners before each exec review. What matters is that the six categories are consistently present and that each metric has an assigned owner who is accountable for its accuracy.
Assign a metric owner for each of the six categories
Reliability goes to the SRE or VP Engineering. Spend and waste go to FinOps or the CFO team. Unit economics is jointly owned by Engineering and Product. Governance sits with the CIO or platform team. Strategic investment is a CTO and CFO joint responsibility.
Connect each metric to a named data source
For reliability, your uptime monitoring platform is the source of truth. For cost, cloud billing APIs provide raw data. For unit economics, that data needs to be calculated — cost pool divided by business unit from your product analytics system. Document the source for each metric so it is reproducible.
Use a simple RAG status per metric
Red, amber, green against a pre-agreed threshold. SLO attainment above 99.5% is green. Cloud spend within 5% of forecast is green. Cost-per-user trending down quarter-over-quarter is green. This removes subjective interpretation from the exec review and focuses discussion on the amber and red items.
Integrate the dashboard into existing meeting cadences
Do not create a new meeting. The weekly CTO/VP Engineering standup should include the reliability view. The monthly exec review should cover all six metrics. The quarterly board prep should include trend data and strategic investment tracking. Embedding it in existing structure is what makes the dashboard sustainable.
Review Cadence Reference
| Cadence | Audience | Focus |
|---|---|---|
| Weekly | CTO, VP Eng, FinOps lead | Reliability signals, active incidents, spend pace vs weekly budget run-rate |
| Monthly | Full C-suite | All six metrics, previous month vs plan, unit economics trend, waste progress |
| Quarterly | C-suite + Board prep | Strategic investment tracking, YTD vs annual budget, unit economics YoY, governance score |
What a Healthy Dashboard Looks Like
A healthy CXO dashboard is not one where everything is green. It is one where the C-suite can look at the six metrics and agree on what the priorities are. Some amber is normal and expected — it surfaces where attention is needed. What a healthy dashboard prevents is the situation where nobody realises there is a problem until it hits the P&L or a major incident.
The most common failure mode for CXO dashboards is metric sprawl — adding more metrics until the page becomes impossible to read. The six categories described here are designed to be the ceiling, not the floor. Each one has a clear business interpretation. If a proposed addition cannot be explained in one sentence to a non-technical board member, it probably belongs in an operational dashboard rather than the CXO view.
The second failure mode is owner vacuum — metrics that exist on the dashboard but have no named person responsible for their accuracy. Before the first review, every metric needs a name next to it. That person is accountable for data quality and for preparing a one-paragraph interpretation of the current status each review cycle.
Where MonitorGiant Fits
MonitorGiant provides the reliability data layer for the CXO dashboard. The platform monitors uptime, SLO attainment, SSL certificate health, and API performance across your core services — producing the availability and incident signals that feed the Reliability metric on the dashboard.
For teams running AI-heavy workloads, MonitorGiant also surfaces cost signals around token consumption and model usage patterns that inform the Cloud & AI Spend and Unit Economics metrics. Combined with your FinOps tooling for the cost allocation side, it gives the SRE and FinOps teams the data they need to show up to the monthly exec review with credible, up-to-date numbers.
Get the Reliability Data Your CXO Dashboard Needs
MonitorGiant monitors uptime, SLOs, APIs, and AI cost signals — giving your SRE and FinOps teams the data that feeds the exec view. Set up in minutes, no card required.
Written by
Dileep KK, MonitorGiant
LinkedIn21+ years in IT infrastructure management and observability. Built monitoring dashboards, custom alerting pipelines, and AI token-tracking systems across cloud platforms — AWS, GCP, and Azure — and for organisations spanning defence IT, IoT manufacturing, digital marketing, SaaS email, insurance broking, parliamentary digital services, and educational ERP. Active directory, SIEM, WAF, Cloudflare, MSSQL, Linux, Windows, Entra ID — operated at every layer of the stack.